26Sp-MedialAxis
Medial Axis Transformation and Graph-Based Floor Plan Generation
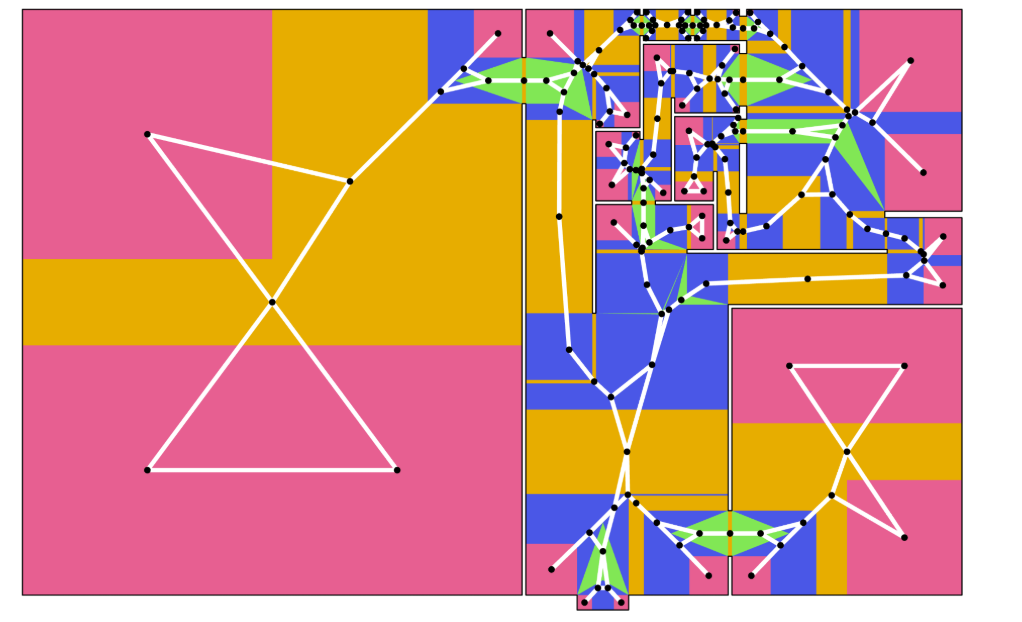
Overview
The Medial Axis Transformation (MAT) converts the two-dimensional layout of a building’s interior space into a one-dimensional geometric and topological representation. This reduces the complexity of floor plan data while preserving important structural information, including circulation paths, spatial adjacency, and partition relationships.
This project implements and extends MAT for building floor plans inside the Rhino / Grasshopper environment. The long-term goal is to use medial axis graphs as a robust, vector-based representation for downstream computational analysis, machine learning, and generative floor plan design.
In Spring 2026, the project expanded beyond medial axis extraction to also explore graph generation and room label prediction using datasets such as the Modified Swiss Dwellings (MSD) dataset.
Motivation
Most building floor plans are unique, which makes systematic and automated analysis difficult. The Medial Axis provides a compact way to represent the underlying structure of interior space while maintaining geometric meaning.
By converting floor plans into graph-based representations, this project supports applications such as:
- Building layout classification
- Spatial and circulation analysis
- Prediction of room or functional labels
- Graph-based floor plan generation
- Generative architectural design using graph neural networks
Project Objectives
The project has two connected objectives:
- Medial Axis Extraction
- Develop a custom vector-based Medial Axis Transformation pipeline for complex building floor plans.
- Support polygons with interior holes, partitions, and irregular building geometries.
-
Integrate the pipeline into Rhino / Grasshopper.
-
Graph-Based Floor Plan Modeling
- Use building graphs as inputs for machine learning and generative models.
- Train graph generation models on floor plan datasets.
- Predict room labels for generated graphs.
- Evaluate whether generated and labeled graphs resemble realistic building layouts.
Theoretical Background
The Medial Axis of a polygon is closely related to the Voronoi diagram of its boundary geometry. For floor plans represented as line segments, a Voronoi diagram provides a natural computational foundation for extracting medial axis segments.
However, Voronoi diagrams generated from boundary segments contain extra geometry that does not belong to the true medial axis. A major part of this project therefore focuses on:
- Classifying Voronoi edges
- Filtering invalid or irrelevant edges
- Handling complex geometries with holes and partitions
- Constructing a clean graph representation from the remaining medial axis segments
Implementation Overview
Method: PyVoronoi-Based Implementation
This approach uses PyVoronoi, a Python wrapper around Boost computational geometry algorithms, to generate Voronoi diagrams from floor plan line segments directly inside Grasshopper.
Tools
- Rhino / Grasshopper
- Custom Grasshopper Python component
- Python 3
- PyVoronoi
Input Representation
Floor plans are represented as integer-based line segments, including:
- Exterior polygon boundaries
- Interior holes
- Room partitions
- Wall segments
Processing Pipeline
-
Voronoi Diagram Generation
A 2D Voronoi diagram is computed from the floor plan boundary segments. -
Voronoi Cell Classification
Voronoi edges are classified based on the originating boundary feature types, including: - Concave
- Convex–Convex
- Convex–Line
-
Line–Line
-
Medial Axis Extraction
Voronoi geometry that does not correspond to the true medial axis is filtered out. -
Graph Construction
The remaining medial axis segments are converted into a graph representation, where connectivity and adjacency relationships can be analyzed computationally.
Graph Representation
After medial axis segments are extracted and classified, they are converted into a graph structure.
The graph representation captures:
- Circulation paths
- Spatial adjacency
- Room connectivity
- Topological structure of interior partitions
This graph becomes the main interface for downstream analysis, evaluation, and machine learning.
Spring 2026 Graph Generation Work
During Spring 2026, the project expanded to investigate how floor plan graphs could be generated and labeled using machine learning methods.
Dataset
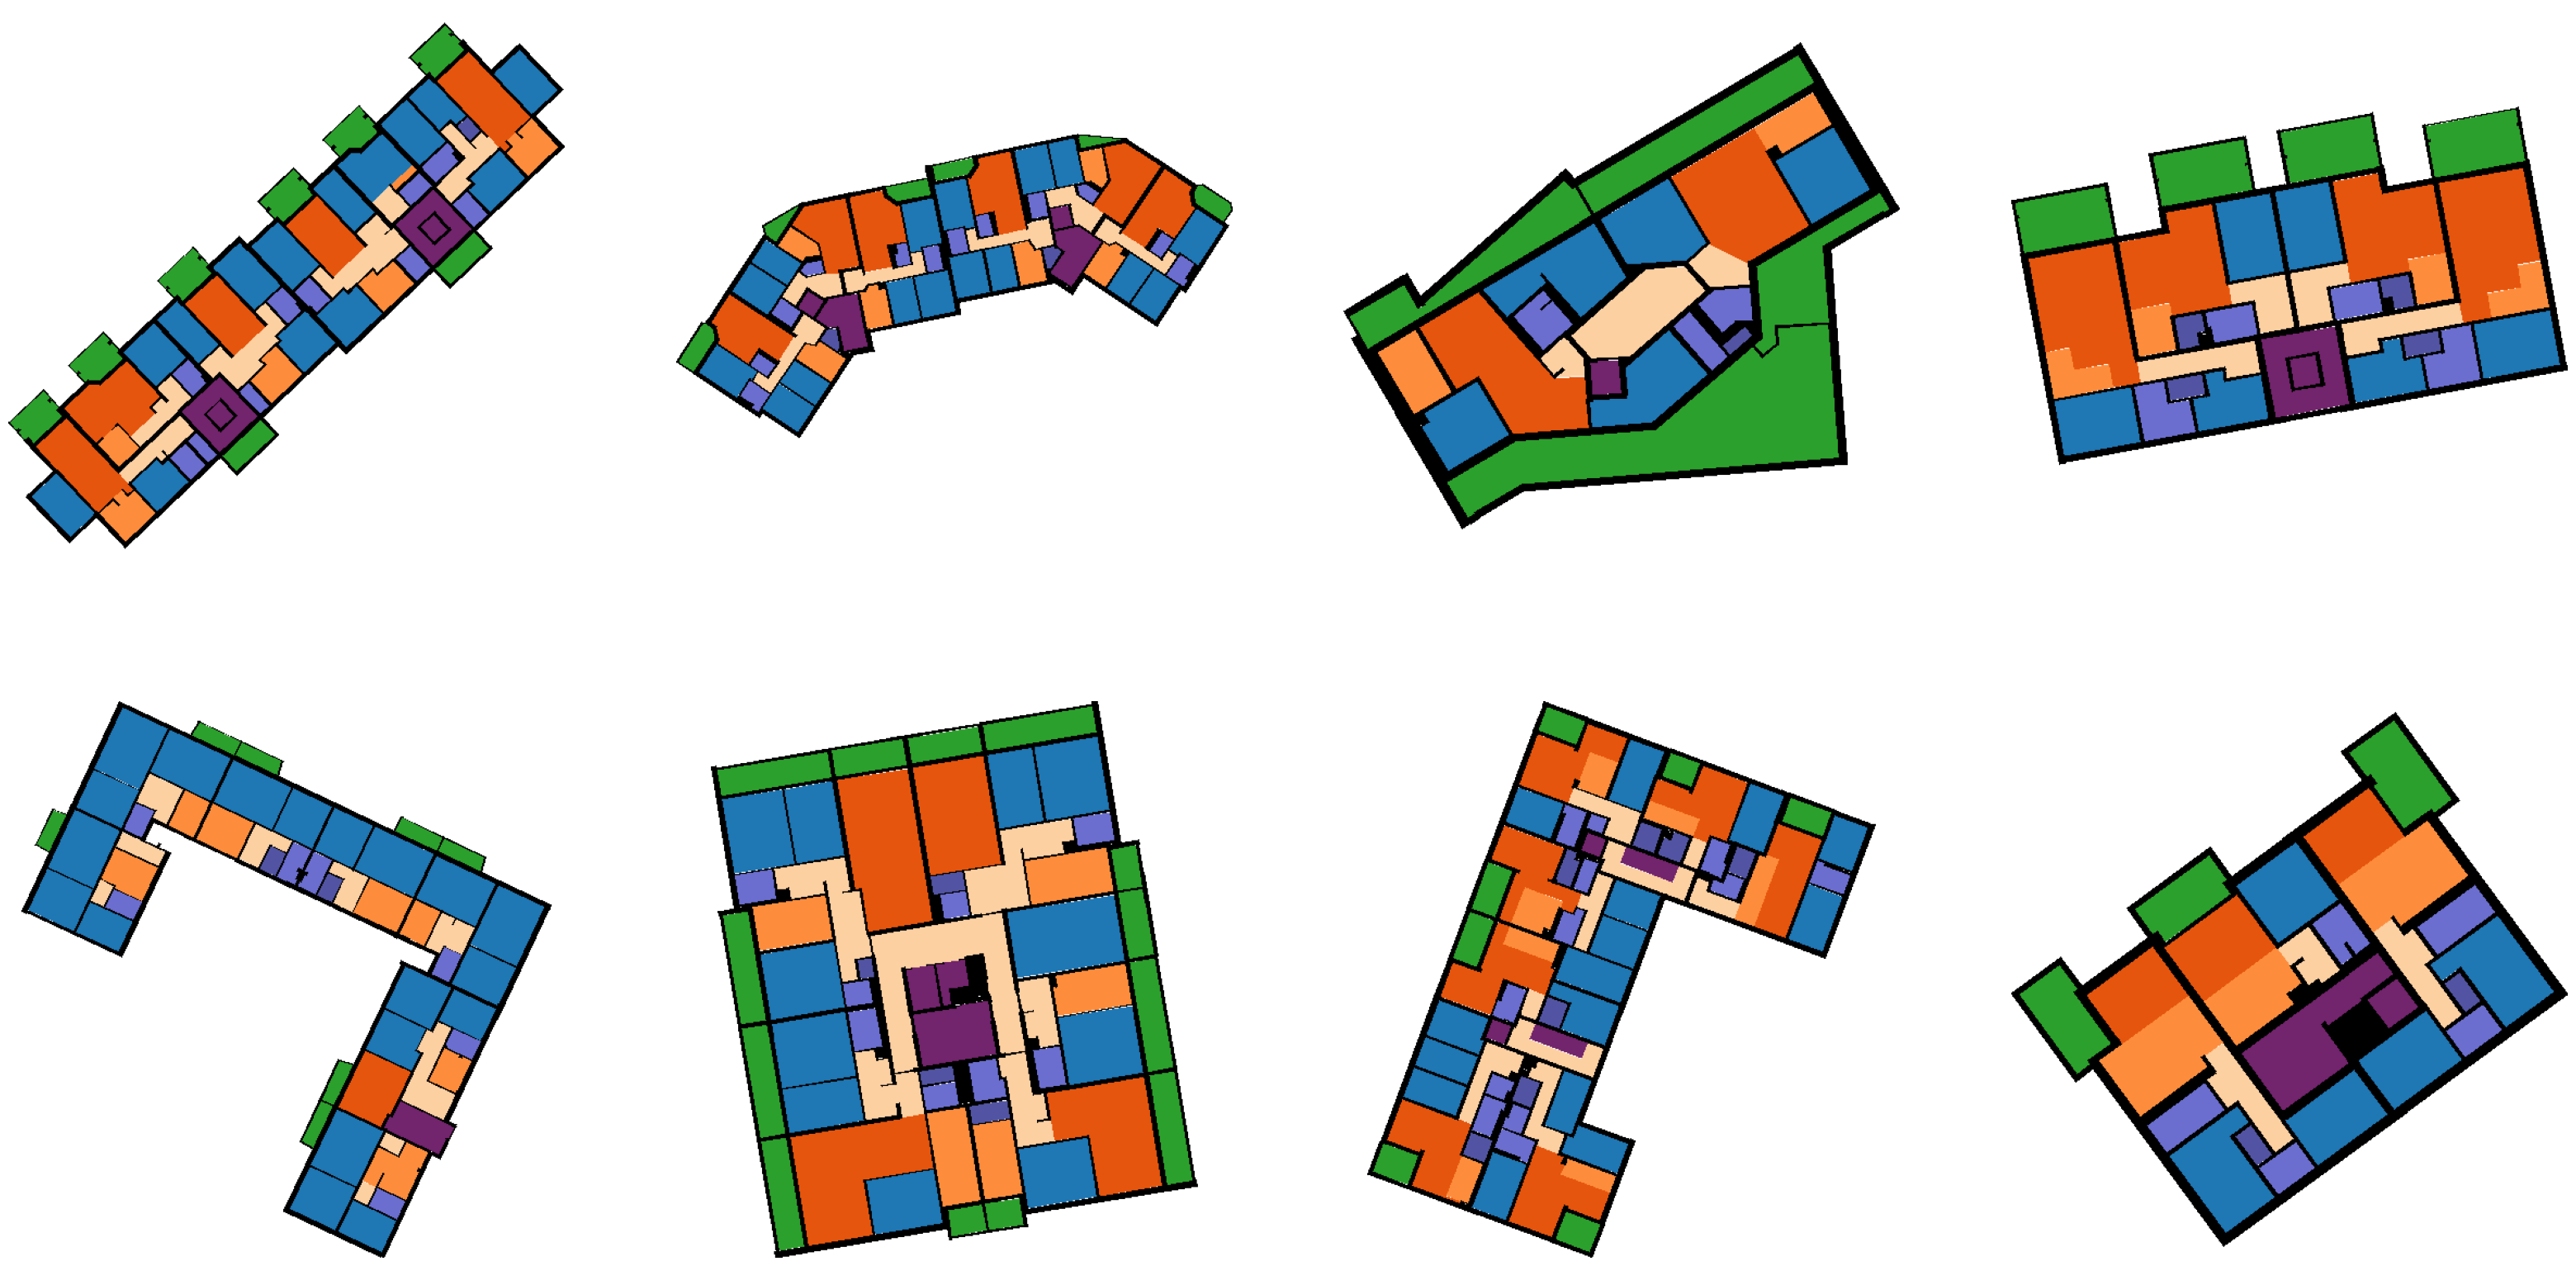
The main dataset explored was the Modified Swiss Dwellings (MSD) dataset, which contains labeled graph representations of building layouts.
Two graph representations were considered:
graph_ingraph_out
These graph sets were evaluated as possible training inputs for graph generation and node labeling models.
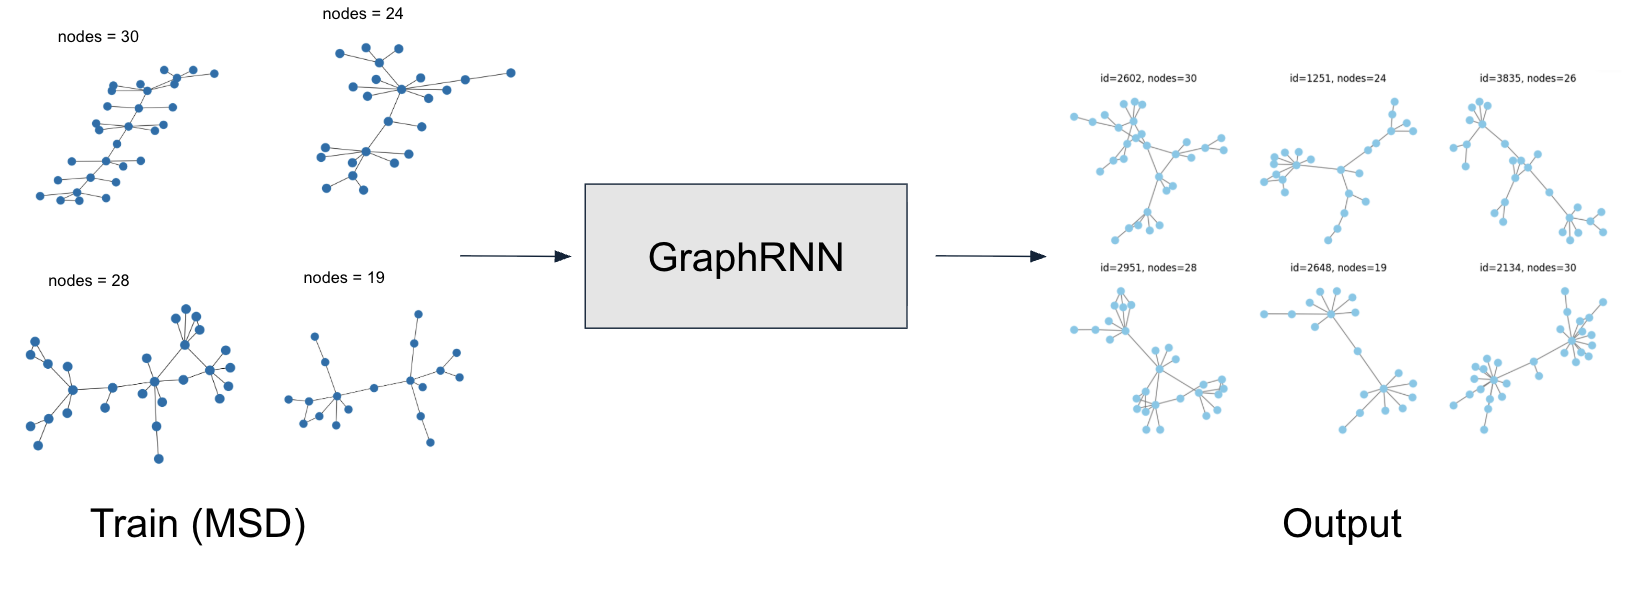
GraphRNN Pipeline
A major focus was adapting the MSD dataset to work with GraphRNN, a graph generative model.
Preprocessing steps included:
- Loading MSD graphs in NetworkX format
- Removing disconnected graphs
- Filtering graphs by node count
- Keeping graphs with 4–36 nodes
- Converting graphs into the expected GraphRNN input format
- Creating a custom configuration file for the Swiss / MSD dataset
Initial GraphRNN training was completed successfully on the processed MSD graphs.
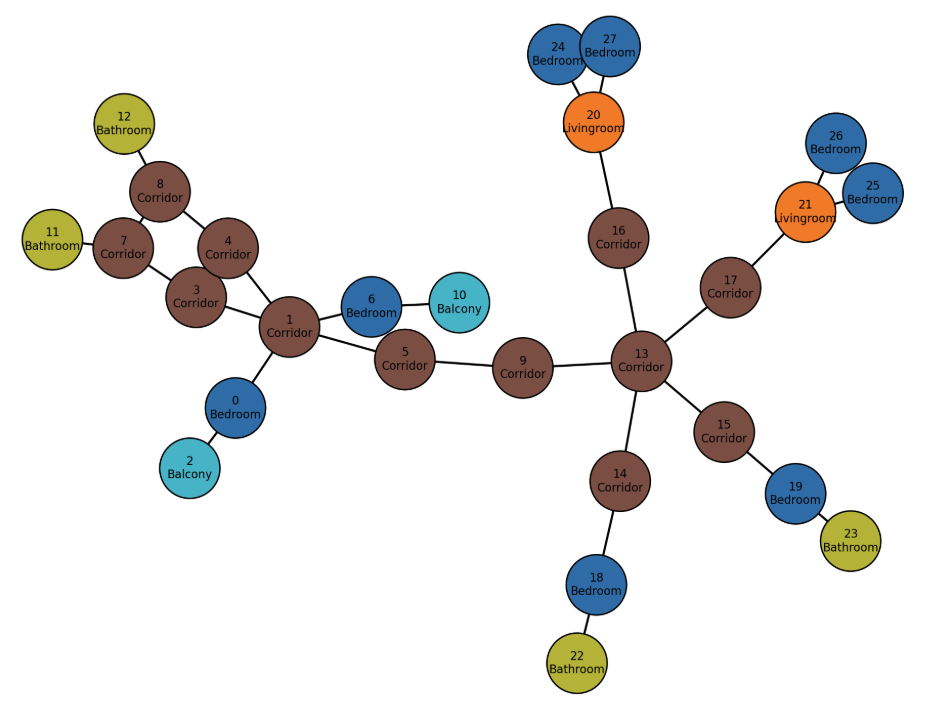
Graph Labeling
Since generated graphs are initially unlabeled, the project also explored methods for assigning room labels to graph nodes.
The main approaches considered were:
- GraphSAGE
- A learning-based method for inductive node label prediction.
- Uses structural node features such as degree and clustering coefficient.
-
Can generalize to unseen generated graphs.
-
Wave Function Collapse (WFC)
- A constraint-based labeling method.
- Treats room labeling as a graph constraint satisfaction problem.
-
Can enforce valid room-to-room adjacency rules.
-
Dataset-derived adjacency rules
- Room label pairs from the MSD dataset are counted and used as a plausibility metric.
- Generated labels can be evaluated based on whether their adjacency patterns resemble real floor plans.
GraphSAGE Progress
GraphSAGE was tested as a room label prediction model.
The pipeline included:
- Training on floor plan graph data
- Using structural node features such as:
- Node degree
- Clustering coefficient
- Neighborhood structure
- Adding validation splits
- Testing label prediction on generated graphs
One challenge was that training graphs may include semantic features, while generated graphs only contain structural features. To reduce this mismatch, semantic features were randomly dropped during training so the model could learn to make predictions from structural information alone.
This improved initial label prediction accuracy from roughly 50% to 70%.
Graph Evaluation
A key challenge is that a single unlabeled graph may have multiple valid room labelings. Because of this, exact label matching is not always the best evaluation method.
Instead, the project considers graph validity in terms of whether the labeled graph resembles a realistic building layout.
Evaluation ideas include:
- Checking room-to-room adjacency validity
- Comparing generated adjacency distributions to MSD dataset statistics
- Measuring graph structural similarity
- Comparing generated graphs against
graph_inandgraph_out - Evaluating whether directed graph orientations satisfy spatial constraints
Directed Graph Orientation
The project also explored converting undirected building graphs into directed graphs.
One proposed approach uses the Z3 SMT solver to assign valid edge directions under graph constraints. This allows the system to search for graph orientations that satisfy rules such as:
- No cycles
- Reachability from a root node
- Reachability between selected source and target nodes
- Valid directional structure for access or circulation graphs
This direction supports the broader goal of representing spatial hierarchy and access depth in building layouts.
Future Work
Future work includes:
- Improving the medial axis extraction pipeline for complex real-world floor plans
- Integrating robust 2D Voronoi segment computation through CGAL
- Refining graph construction from medial axis geometry
- Training stronger graph generation models on MSD graphs
- Improving GraphSAGE-based room label prediction
- Comparing GraphSAGE against Wave Function Collapse and rule-based methods
- Formalizing adjacency-based validity metrics
- Exploring directed graph representations for spatial hierarchy
- Using medial axis graphs as inputs for complete floor plan generation
Presentation
Team
| Name | Seniority | Major | School | # Semesters | GitHub |
|---|---|---|---|---|---|
| Rohak | Undergrad | Computer Science | SCS | 1 | ragarwal46 |
| Jessica Hernandez | Masters | Computer Science | SCS | 3 | jhernandez312 |
| Gonzalo Vegas | PhD | Architecture | ARCH | 4 | gvegasol |